 BTC SNIPERS
Volume Profile on TradingView: POC, VAH, VAL, HVN and LVN explained
A normal volume bar tells you how much traded in a period of time. A volume profile turns that sideways and shows how much traded at each price. That one change shows where the market agreed on price and where it moved through quickly.
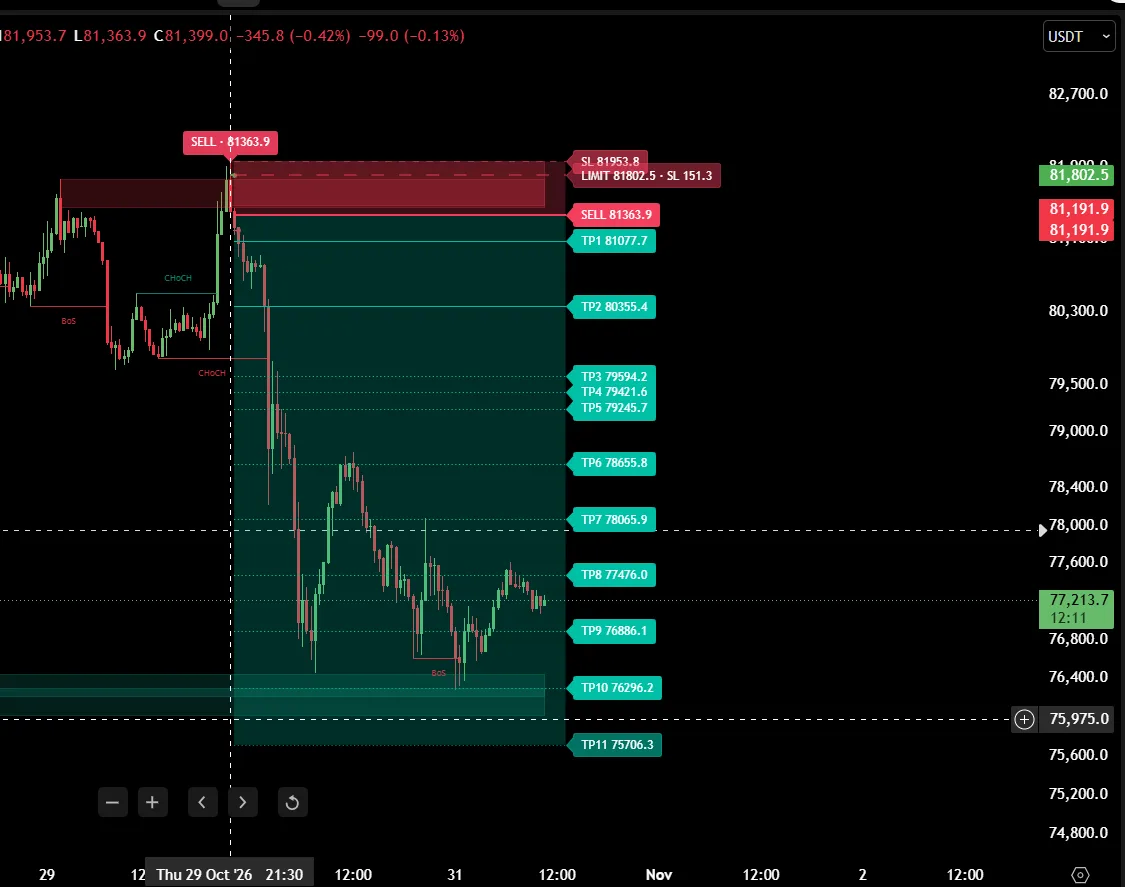
What a volume profile shows
A volume profile is a horizontal histogram drawn next to price. Each row is a price level, and its length is the volume traded there during the session (for example one day). Long rows are prices the market accepted. Short rows are prices it rejected or passed through fast.
The five levels every trader should know
- POC (Point of Control) – the single price with the most volume in the session. It is the fairest price of that session.
- Value Area (VAH and VAL) – the range around the POC that holds about 70% of the session's volume. The top is the Value Area High (VAH), the bottom is the Value Area Low (VAL).
- HVN (High Volume Node) – a thick part of the profile. Price tends to slow down and spend time here.
- LVN (Low Volume Node) – a thin part of the profile. Price tends to move quickly through it, or react sharply at its edge.
How traders use these levels
Many traders watch how price behaves when it returns to the levels of earlier sessions:
- Rejection – price tests yesterday's VAH, VAL or an LVN and closes back inside. This suggests the level is still respected.
- Acceptance – price moves through the level and holds beyond it for some time. The old level loses importance.
- Sweep – price briefly breaks a prior session's high or low and then returns. Stops beyond the level are taken before the move reverses.
The level alone is not a signal. What matters is the reaction at the level, ideally confirmed on a closed candle.
Session profiles vs. fixed range
TradingView offers several profile tools. A session profile builds one profile per day, which makes it easy to compare today's price with yesterday's value. A fixed range profile covers the area you select. For intraday crypto trading on the 30-minute chart, daily session profiles of the last few days are a practical starting point.
Common mistakes
- Treating every line as support or resistance. Too many levels hide the important ones.
- Entering before the candle closes. A wick through a level is not a rejection until the candle closes back inside.
- Ignoring the bigger picture. A rejection against a strong trend often fails.
See it on a live chart
Sniper Pro V2 and BTC Snipers Institutional Activity draw these levels and setups for you on TradingView.
Educational content only. Not financial or investment advice. Trading crypto derivatives carries a high risk of loss. See the risk disclaimer.